 FP0382 : Conjunctival inflammatory markers in Primary open angle glaucoma & Primary angle closure glaucoma
Dr. KIRTI SINGH
Dr.DR. UMESH ., DR. ARSHI SINGH
Semi Final
Abstract
Objective:
Compare conjunctival cellular & inflammatory profile (quantitative & qualitative) in POAG & PACG patients undergoing trabeculectomy
Material & Methods:
30 eyes scheduled for trabeculectomy (15 POAG & 15 PACG), underwent conjunctival biopsy. Cellular profiling of conjunctiva done with Haematoxylin Eosin, PAS & Masson’s trichrome stain, along with CD3, CD20 & CD64 markers.
Results:
Cellular profile in POAG with mean goblet cells of 14.2 / mm2 & CD68+ at 13 was significantly less than PACG cases with comparative values of 5 & 7.
CD3+cell count at 22 & CD20+ at 5 in POAG did not significantly differ from PACG cases with respective values of 21 & 10.
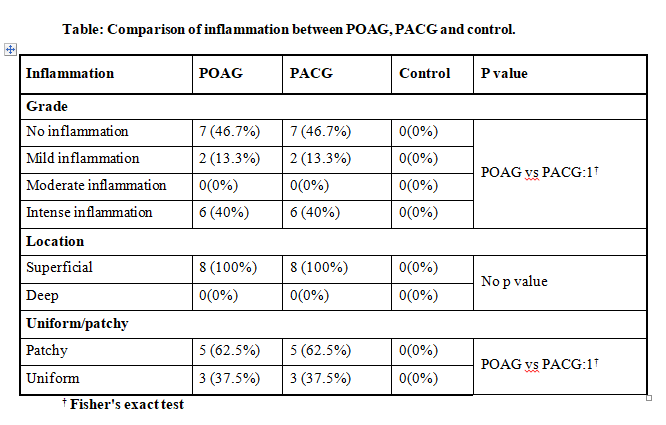
All inflammatory cells were superficial with patchy distribution in 63 %.
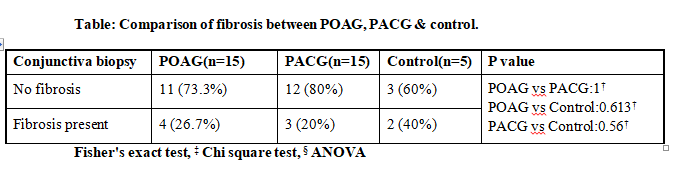
Conjunctival fibrosis present in 1/4th (26%), was mild in 13 % to intense in 40%.
Conclusion: Conjunctive of PACG & POAG patients had comparable conjunctival cellular profile except for reduced goblet cells & CD68 cells in closed angle subtype.
Full Text
Conjunctival inflammatory markers in Primary open angle glaucoma and Primary angle closure glaucoma
Kirti Singh, Umesh, Sushil Kumar, Ravindra K Saran Guru Nanak Eye Centre, MAMC, New Delhi
Objective:
Compare conjunctival cellular & inflammatory profile (quantitative & qualitative) in POAG & PACG patients undergoing trabeculectomy .
Material & Methods:
30 eyes scheduled for trabeculectomy (15 POAG & 15 PACG), underwent Conjunctival biopsy. Cellular profiling of conjunctiva done with Haematoxylin Eosin, PAS & Masson’s trichrome stain, along with CD3, CD20 & CD68 markers.
Results:
Cellular profile in PACG with median CD68+ at 6.7 was significantly less than controls 19.2(p=0.002) & non significantly less than POAG with median 9.3
Cellular profile in PACG with median CD20+ at 6 was significantly more than controls at 0 (p=0.019) & non significantly more than POAG with median at 3.6
Cellular profile in PACG with median CD3+ at 20 was significantly more than controls at 5.7 (p=0.029) & POAG with median at 19.1 was significantly more than control 5.7(0.021). POAG vs PACG was not significant.
Cellular profile in PACG with median goblet cells at 3 was non significantly less than POAG at 10 & equal to control at 3.
All inflammatory cells were superficial with patchy distribution in 63 %.
Conjunctival fibrosis present in 1/4th (26%) in both POAG & PACG, was mild in 13 % to intense in 40%. Fibrosis in 40 % controls.
Conclusion :
Conjunctive of PACG & POAG patients had comparable conjunctival cellular profile although with respect to controls CD3+, CD20+ were more & CD68+ were less.
INTRODUCTION:
Glaucoma is the leading cause of irreversible blindness in the world with an estimated 34 million people worldwide being affected by 2040 (1).Glaucoma can be classified into primary and secondary type which decides treatment
protocol. Primary angle closure glaucoma (PACG) is a major form of glaucoma in East Asia(2) while primary open angle glaucoma (POAG) predominates in Caucasians and African(3,4). Recent studies in India report a high prevalence
of PACG at 4.3% (5,6). This subtype blinds more people than POAG, despite the latter entity being more prevalent worldwide(7).
Trabeculectomy surgery still remains the most commonly performed surgery for glaucoma recalcitrant to medical therapy. The surgery creates a new path for aqueous outflow which bypasses the diseased trabecular meshwork to form a
subconjunctival bleb. Bleb functionality and longevity is determined by extent of subconjunctival fibrosis, the latter being the commonest cause of bleb failure. Conjunctiva being the reservoir of fibroblast recruitment at the
time of filtration surgery, its preoperative health is likely to play a crucial role in tissue behaviour in response to trauma of surgery.
Primary angle closure glaucoma (PACG) eyes have been documented to present with higher Intraocular pressure (IOP). Recurrent bouts of high IOP in these eyes result in ischemia and reperfusion injury, manifesting with iris
atrophy and subclinical inflammation in conjunctiva of ACG eyes. Anatomical aspects of ACG with smaller eyeballs, smaller palpebral fissure and shallow fornices, thicker iris and thicker lens also make trabeculectomy
challenging. Concomitant tear film dysfunction subsequent to long term use of anti-glaucoma medications (AGM) resulting in deranged conjunctival milieu and thus reduces chance of bleb survival. Due to the above reasons,
filtering surgery in PACG behaves differently from POAG eyes.
Keeping the large volume of PACG patients in India, it’s tendency to cause more blindness, and surgical differences in mind, we studied trabeculectomy outcomes in angle closure glaucoma versus open angle glaucoma with respect to
bleb morphology and function. Conjunctival cellular profile was studied for cell markers of inflammation and linkage to bleb survival. There is paucity of data in Indian population comparing trabeculectomy outcomes in Primary
Angle Closure Glaucoma and Primary Open Angle Glaucoma. Also, paucity of data on relationship of conjunctiva cellular profile with respect to bleb functionality and morphology in Primary Angle Closure Glaucoma eyes has been
noted. Current study aims to compare surgical outcome of trabeculectomy in Primary Angle Closure Glaucoma and Primary Open Angle Glaucoma eyes and correlate conjunctival cellular profile with bleb function and morphology.
MATERIAL AND METHODS
Current study was a hospital based Prospective Comparative study conducted in Department of Ophthalmology, Guru Nanak Eye Centre, New Delhi. In this study patients with uncontrolled primary glaucoma requiring trabeculectomy aged
>18 years & patient willing to follow up for minimum 4 months were included. All patients with prior incisional surgery involving conjunctiva, dry eyes, using long-term topical steroids, chronic ocular pathology like keratitis,
uveitis, episcleritis and scleritis were excluded. Primary outcome evaluated was Bleb functionality and morphology & conjunctival cell profile. Secondary outcome evaluated was conjunctival inflammation correlation with bleb
function and morphology.
Suitable patients meeting the inclusion criteria were enrolled in the study and evaluated on the below mentioned parameters prior to the surgery. Patients were divided into two groups POAG & PACG undergoing trabeculectomy (15
patients each). Trabeculectomy with releasable sutures with use of mitomycin C (0.02% for 2 min) restricted to patients younger than 50 years, was performed by the same surgeon. A conjunctival frill incision followed by a
triangular superficial flap of 4 X 4mm followed by 2X1 mm sclerostomy by Kelly Descemet punch and large peripheral iridectomy was done. The scleral flap was closed by one fixed and 2 releasable sutures.
Conjunctival closure by 8-0 nylon was followed by on table titration of bleb. The conjunctival tissue biopsy was taken from inferior conjunctiva of size 2X3 mm at the time of trabeculectomy. The tissue was immediately fixed in
10% buffered formalin and processed as per protocol to have formalin fixed paraffin embedded (FFPE) tissue. Thin sections of 3 microns were cut. Care was taken to orient sections to obtain epithelium and stroma. Cut sections
were stained for haematoxylin and eosin and PAS with Diastase with Alcian blue. Immunohistochemistry was performed as per protocol of various primary antibodies (T lymphocytes -CD3, B lymphocytes- CD20 & Macrophages-CD68). With
light microscopy cells were counted at 40 magnifications using a micrometer eyepiece, each field representing a surface of 0.1 mm2. Inflammatory cell counts were performed in the conjunctival stroma in four different fields and
averaged to obtain the representative mean cell count of the labelled immunocompetent cells.
Inflammatory cells in blood vessels were not counted. All specimens were observed in a masked manner by one examiner. The average values (mean, median & standard deviation) of cell counts in all groups were calculated.
Parameters evaluated were -Intraocular pressure (IOP): measured by Goldman Applanation tonometry (GAT), Conjunctival biopsy: Cellular profile: macrophages (CD68), lymphocytes (CD3, CD20) fibroblast (Haematoxylin & Eosin), goblet
cell (PAS with diastase with Alcian blue), Best corrected visual acuity (BCVA), Slit lamp examination: AC reaction: Standard Uveitis Nomenclature (SUN Classification),Cataract state (LOCS), Bleb morphology assessment: IBAGS,
Anterior segment optical coherence tomography (ASOCT): Bleb characteristics evaluated were-Bleb wall thickness at – i) 12 O’ clock position ii) At area of greatest height, Bleb reflectivity was evaluated throughout bleb area,
Ocular surface Disruption: by Tear Break Up Time (BUT) and keratometry, Complications during or after surgery including the requirement for Bleb needling, Visual fields examination by Humphrey field analyser 24-2/10-2 as
required, Number of anti-glaucoma medications used. Patients were then subsequently evaluated on post- operatively on Day 7, 1 month, and 4 months.
Complete success of trabeculectomy was defined as IOP ≤21 mmHg without any additional medication, whereas qualified success was defined as IOP ≤21 mmHg with or without medication. Failure was defined as uncontrolled IOP >21 mmHg
despite medical treatment, or when an additional intervention (such as repeat trabeculectomy, or diode laser cyclodestruction, etc.) was required
STATISTICAL ANALYSIS
Categorical variables were presented in number and percentage (%) and continuous variables were presented as mean ± SD and median. Normality of data was tested by Kolmogorov-Smirnov test. If the normality was rejected then non
parametric test were used.
Statistical tests were applied as follows- Quantitative variables were compared using Unpaired t-test/Mann-Whitney Test (for non- normal distribution of data sets) between the two groups.
. Qualitative variables were compared using Chi-Square test /Fisher’s exact test. A p value of <0.05 was considered statistically significant. The data was entered in MS EXCEL spreadsheet and analysis done using Statistical Package for Social Sciences (SPSS) version 25.0.
RESULTS AND OBSERVATIONS
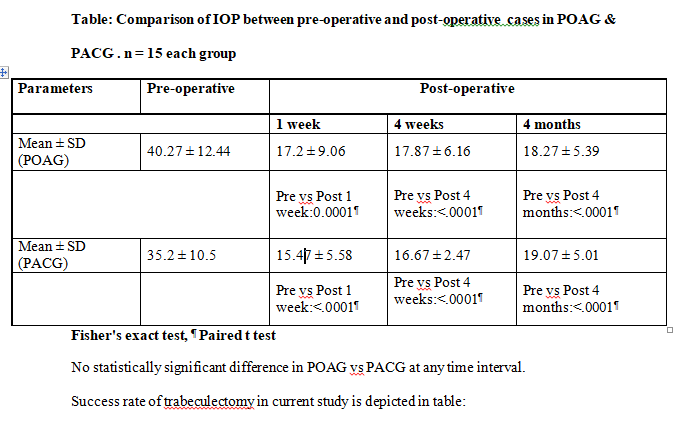
Comparison of trend of IOP in both groups is shown in table:
In current study 22 (73.3%) patients were using 3 antiglaucoma medications. 12 (80%) POAG patients compared to 10 (66.67%) PACG patients used 3 antiglaucoma medication before trabeculectomy. There was no statistically
significant difference between 2 groups (p=0.56). AGM were taken for a mean duration of 8+1.25 Months in POAG vs 6.75+2 months in PACG. It was not statistically significant.
POAG group blebs had tendency to achieve low to medium height at 4 months. Around 60% (9) with medium height, 33.35% (5) low height, 6.7% (1) each having flat and high bleb at 4 months. Mild-moderate vascularity was seen, with
60% (9) moderate vascularity, 33.4% (5) mild vascularity & 6.7% (1) avascular cystic bleb at 4 months. Most blebs at 86.7 % (13) had extent of more than or equal to 4 clock hours whereas 13.3% (2) had extent of 3 clock hours. No
patient had any bleb leak till last follow up (Seidel’s negative).
PACG group blebs had tendency towards achieving low to medium height at 4 months with 80% (12) medium height, 13.3% (2) low height & 6.7% (1) high bleb. Mild-moderate vascularity was common, with 66.7% (10) moderate vascularity
and 33.34% (5) mild vascularity. Bleb extent of more than or equal to 4 clock hours was seen in 73.34% (11) and 26.7% (4) extent of 3 clock hours. No patient had any bleb leak till last follow up (Seidel’s negative). No
statistically significant difference was seen in bleb morphology between the 2 groups.
In POAG group, 66.7% (10) patients had high reflectivity & 33.3% (5) low reflectivity. Morphology pattern: Filtering bleb with microcysts 86.7% (13), 6.67% (1) cystic & 6.67% (1) flat Mean height: 567.5 ± 28 microns (4weeks) &
it was 540.2 ± 242.1 at 4 months. Bleb wall thickness at 12 o clock: 326.13 ± 119.6 (4weeks) & 308.73 ± 111.7 (4 months). Bleb wall thickness (at maximum height): 321.9 ± 113.2 (4weeks) & 304.1 ± 97.6 (4 months) In PACG
group: 66.67% (10) patients had high reflectivity & 33.33% (5) had low reflectivity.
Morphology pattern: 93.33% (14) had filtering bleb with microcysts, 6.67% (1) had cystic bleb. Mean height: at 4 weeks was 538.73 ± 136.69 & at 4 months it was 516.53 ± 118.55 microns. Bleb wall thickness at 12 o clock: at 4
weeks was 283.53 ± 99.47 microns & at 4 months it was 284.47 ± 90.7 microns. Bleb wall thickness at maximum height: at 4 weeks was 285.93 ± 90.1microns & at 4 months it was 281.27 ± 89.28 microns. There was no statistically
significant difference between 2 groups in any of ASOCT parameters.
Comparison of astigmatism in both groups is shown in table
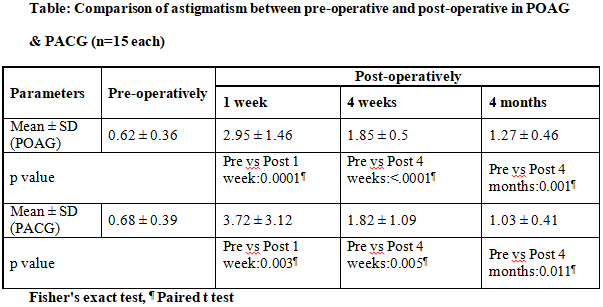
There was no statistically significant difference between 2 group (p=0.15).
TBUT assessment is shown in Table:
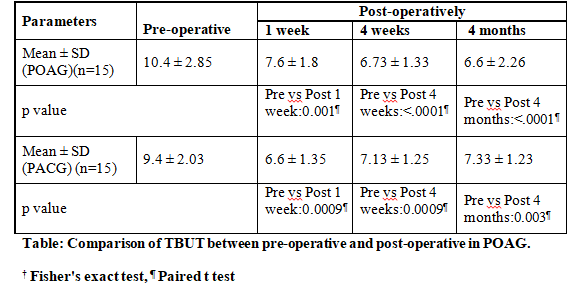
Comparison between POAG & PACG was not statistically significant.
The mean deviation value in visual fields in preoperative period ranged from 2.56-33.58 decibel. In preoperative period, in POAG group MD value was -19.78 ± 12.08 decibel. At post op 4 months the value deteriorated to 20.56 ±
12.28 decibels, that is a change of 0.77 ± 0.63decibals.
This change was statistically significant (p=0.002). In PACG group, mean MD value was 24.03 ± 7.29 decibels in preoperative period which deteriorated to 25.25 ± 8.08 decibels at 4 months postoperatively, that is a change of 1.87
± 3.22 decibels. This change however not statistically significant (p=0.1). Also, there was no statistically significant difference between the 2 groups in preoperative (p=0.327) & postoperative period (p=0.32).
Intraoperatively we observed that 26.67% (4) patients in PACG group and 20% (3) patients in POAG group had anterior chamber bleeding. The difference was not statistically significant. At 1week post-surgery, 16.67% (5) patients
had hyphema, 20% (3) in POAG group & 13.33% (2) in PACG group. 16.67% (5) patients had shallow AC, 20% (3) in POAG group & 13.33% (2) in PACG group. 13.33% (4) patients had low IOP, 20% (3) in POAG group & 6.67% (1) in PACG
group. In PACG all cases with intraoperative bleeding achieved complete success.
In POAG 60% cases achieved complete success 40 % qualified success at 4 months follow up. 6.67% (1) had cystic bleb in PACG group. 6.67% (1) had overhanging bleb in PACG group while 20% (3) patients of POAG group had congestion
at 4 weeks post-surgery. At 4 months post-surgery, 26.67% (8) patients had cataract progression, 20% patients (3) of POAG group & 33.33% (5) in PACG group. 20% (6) patients had high IOP, in 26.67% (4) of POAG group & 13.33% (2)
in PACG group. 6.67% (1) had cystic bleb in PACG group & 6.67% (1) of POAG had bleb scarring. While 6.67% (1) of POAG had subepithelial keratitis. However, there was no statistically significant difference among 2 groups with
respect to complications.
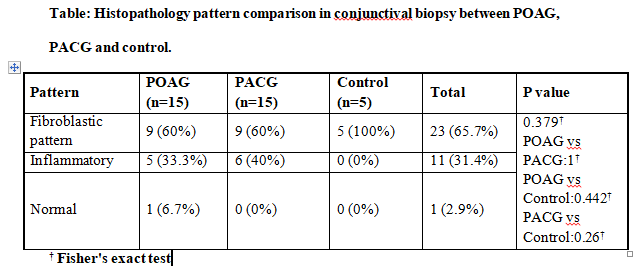
In our study conjunctival biopsy sample was evaluated. Three patterns were defined -normal, inflammatory & fibroblastic pattern.
Histopathological pattern evaluation is shown in table:
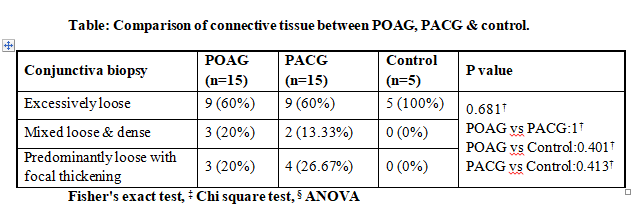
Connective tissue studied in conjunctival biopsy specimen was divided into 3 main types- excessively loose, mixed loose & dense and predominantly loose with focal thickening.
The comparison of POAG & PACG group respectively with control group as well as with each other was not statistically significant.
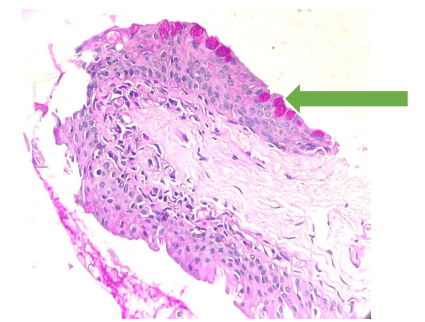
Goblet cells-stained magenta pink (arrow) with Periodic Acid Schiff-Diastase stain (magnification 40X)
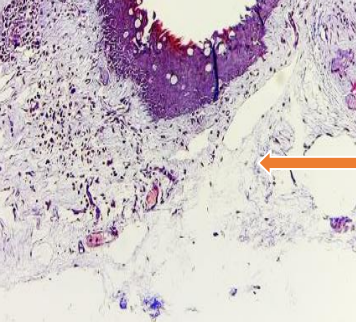
Mixed loose & dense connective tissue (arrow) stained with Massone Trichrome stain
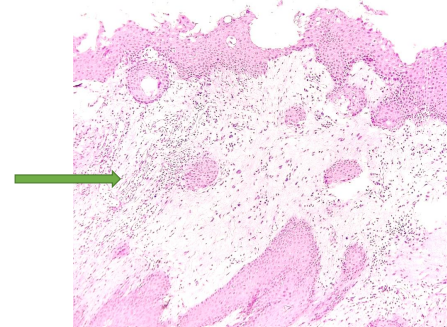
Dense inflammatory infiltrate (arrow) on Hematoxylin-Eosin stain. (Magnification 40X)
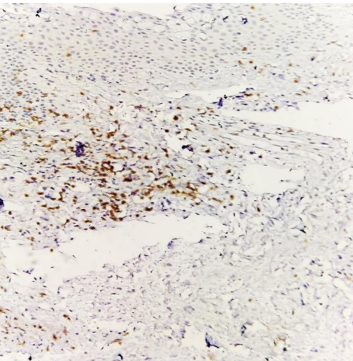
CD3+ cells stained brown (magnification 40X) on immunohistochemistry.
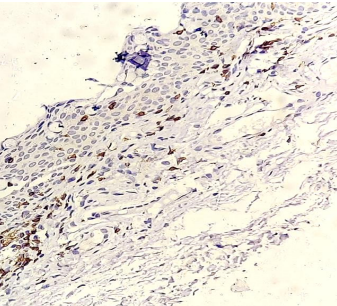
CD20+ cells stained brown (magnification 40X) on immunohistochemistry.
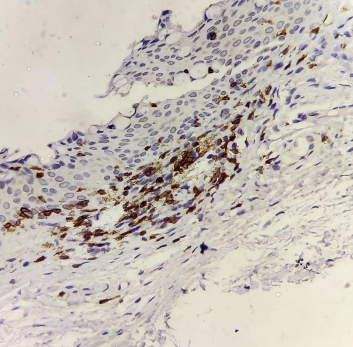
CD68+ cells stained brown (magnification 40X) on immunohistochemistry.
Discussion
The principal aim of this study was to compare surgical outcomes of trabeculectomy in POAG versus PACG and correlation with the conjunctival inflammatory markers. Trabeculectomy remains the gold-standard surgical method for
reduction of intraocular pressure (IOP) in the management of glaucoma(8).
Mean age of study was- 42.37 ± 13.58 years (in POAG) and mean age 38.8 ± 14.79 years (in PACG). All patients in POAG group were males, whereas PACG group comprised of 60% males & 40% female. Positive family history of glaucoma
was present in 27% of POAG cases (4/15) and none in PACG cases. Mean value of CCT was 541.5 ± 32μ (in POAG) versus 538.2 ± 29.5 μ (in PACG). Difference Not Significant statistically.
Visual acuity was retained for most (87%) patients with no intergroup difference.
Post-surgery the reduction of IOP was similar for POAG at 17.9 ± 6.2 mmHg (4 weeks) and 18.3 ± 5.4 mmHg (4 months) and PACG group at 16.7 ± 2.5 (4 weeks) and 19.07 ± 5.01 mmHg (4 months). Maheshwari D et al, while studying
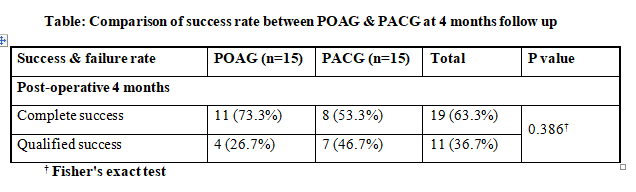
similar group over a 3-year period reported significant improvement in BCVA in ACG compared to OAG group, attributed to a higher number of cataract surgeries performed in the ACG group(9). Complete success was attained in 63.3%
patients and qualified success in 36.7%.
More POAG trabeculectomy were completely successful at 73.3% compared to 53.3% PACG cases, however the inter group difference was Not Significant. Maheshwari D et al have also reported higher success rates for trabeculectomy in
OAG at 68% compared to 55 % in ACG, over a longer follow up of 3 years8. They attributed this to more postoperative complications in PACG particularly cataract extraction resulting in poor IOP control(9). Sihota R on the other
hand with a longer follow-up of 10-year, reported similar success rates of trabeculectomy in PACG and POAG(10). A life-table analysis in a Japanese population also showed comparable 5-year control rates between POAG and PACG
eyes, with no racial differences in Asians and Caucasians(10). The current study required bleb needling to revive bleb in 2 cases of POAG group and one case of PACG.
In current study, both group blebs had tendency to achieve low to medium height, moderate-mild vascularity, extent of more than or equal to 4 clock hours at 4 months follow up. NS. Bleb vascularity, bleb extent had positive
correlation with IOP and bleb height negative correlation with IOP in POAG trabeculectomy NS. For PACG group bleb height, vascularity & extent all had negative correlation with IOP, correlation not attaining statistical
significance. Overall IOP was significantly better controlled in microcystic blebs & low reflectivity blebs at 4 months follow up although intergroup no significant difference could be elicited. Cvenkel B et al and Ciancaglini M
et al correlated successful trabeculectomy with greater area and decreased bleb vascularity, with diffuse and cystic blebs being associated with low IOP(11,12).
No study has prospectively compared bleb morphology in ACG versus OAG, previously. Current study shows that overall IOP was significantly better controlled in microcystic blebs & low reflectivity blebs at 4 months follow up
although intergroup no significant difference was elicited. Also, current study found not statistically significant better IOP control with low bleb height & low bleb wall thickness in both groups at 4 months follow up. Bleb
functionality studies by Ciancaglini M et al, Kawana et al & Pfenninger L et al have identified large internal fluid filled cavity, extensive hypo reflective area, multiform blebs and thicker bleb walls with more microcysts with
successful blebs(12–14). Detailed studies by Singh M et al have linked bleb height, bleb wall thickness, cystic spaces within bleb wall to successful blebs(15).
Other authors have confirmed bleb wall thickness to be negatively correlated with IOP(15,16). Reflectivity of the bleb wall, measured by AS-OCT and width of filtration opening at an early stage have emerged as early
post-trabeculectomy predictors of bleb outcome(17,18). Low reflectivity of bleb wall, presence of posterior episcleral fluid have been associated with lower IOP(14,16). Astigmatism increased at 1week postoperative period in both
groups and remained at 4 weeks despite removal of releasable sutures. Tear film disruption was noted. There were improved TBUT readings over time, but residual TBUT reduction remained till 4 months. Intergroup difference at all
times was NS in both groups.
Number of AGM had negative correlation with preoperative TBUT in both groups. NS. Sherwood M reported higher grades of conjunctival metaplasia, abnormal presence of inflammatory cells and expression of immune markers by
epithelial cells in patients on long term therapy with various anti-glaucoma drugs(19).
Subconjunctival fibrosis due to faster and exuberant wound healing is the most common cause of failure of trabeculectomy(8,20). Bleb failure often occurs during early postoperative months due to hyper-cellular response
characterized by inflammation and fibroblast proliferation, migration, and extracellular matrix deposition(8,21). Broadway D et al in their exhaustive study on reviewing risk factors for filtration failure and possible
underlying perioperative conjunctival cellular mechanisms, proposed that preoperative state of the conjunctiva, which acts as a reservoir for fibroblast recruitment played a crucial role in tissue response to surgical trauma(8).
The relationship between conjunctival cellular profile and risk factors for trabeculectomy failure identified before surgery are critical in development of targeted, patient specific, wound healing modulators(8).
Conjunctival biopsy specimens from long-term treated patients with glaucoma confirm thicker conjunctival epithelium, fibroblastic infiltration, and indications of chronic inflammation(22,23). Baudouin C et al. used impression
cytology & cytochemistry to demonstrate increased expression of inflammatory membrane markers (HLA-DR class II antigens, low-affinity receptor of IgE (CD23) in conjunctival cells in patients on long term AGM therapy(22).
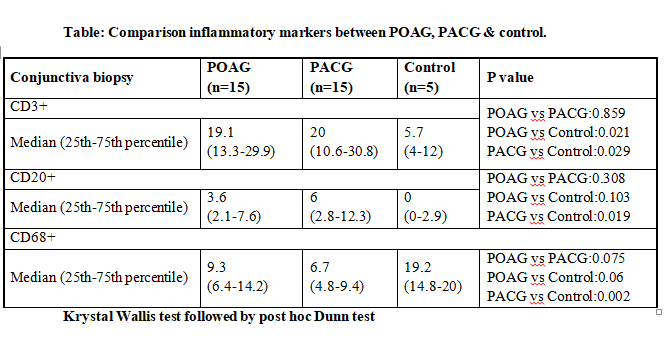
Fibrous pattern was seen in 26% of glaucoma cases (27% patients of POAG, 20% patients in PACG). Inter group comparison NS. Cells positive to CD3+ (T Lymphocytes) were at 5.7 (control), 19.1(POAG) & 20 (PACG). Comparison of POAG
with control (p=0.021) and PACG with control (p=0.029) was statistically significant. Comparison of POAG & PACG was NS. Cells positive to CD20+ (B Lymphocytes) were at 0 (control), 3.6 (POAG) & 6 (PACG). Comparison of PACG with
controls was statistically significant (p=0.019), while POAG vs controls was not statistically significant. POAG vs PACG did not achieve statistical significance. Cells positive to CD68+ (Macrophages) were 19.2 (control), 9.3
(POAG) & 6.7 (PACG).
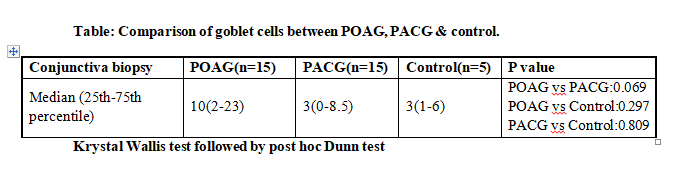
Comparison of POAG group with control was NS, however that of PACG with control did show statistically significant difference (p=0.002). POAG vs PACG was not statistically significant. Number of goblet cells were 3 (control), 10
(POAG) & 3 (PACG). Comparison of both POAG & PACG with controls was NS. POAG vs PACG was NS.
No significant correlation between cell profile & ASOCT Bleb morphology parameters could be inferred from current study. Almost 73 % (22/30) patients were on 3 antiglaucoma medications (80% POAG patients and 67% PACG patients).
Four AGM were used by 20 % (13% POAG and 26 % PACG). Inter group difference was not statistically significant. No statistical correlation could be drawn between inflammation grade and no of AGM used.
Around 47% of glaucoma patients and 100% of control group were found to have no inflammation. Mild inflammation was seen in 13.3% of patients (POAG & PACG group) and intense in 40% (POAG & PACG group). Inflammation was
superficial in all with patchy pattern in 63% & uniform in 38% cases for both POAG & PACG groups. Intergroup comparison of POAG & PACG group NS. A study by Broadway D et al, found that patients briefly treated (AGM duration less
than 2 months) with medications fared as well after trabeculectomy as did the group treated with beta-blockers, with success rates of 90% at minimum follow up of 6 months’ time(8). Addition of miotics however reduced surgical
success rate to 72%, with lowest success at 45% for group treated with beta-blockers, miotics, and sympathomimetics combination(8). It is evident from the above that long-term topical combination therapy posed significant risk
factor for failure of trabeculectomy.
No definitive statistically significant correlation between no. of AGM & cellular profile could be inferred from current study. Broadway D et al analysed preoperative subclinical conjunctival inflammation by conjunctival biopsy
induced by previous topical medication, and found conjunctiva receiving combination therapy (beta blocker, miotic & sympathomimetic) having significant decrease in goblet cell; increased macrophages, lymphocytes in epithelium
with increased fibroblasts, macrophages, mast cells, and lymphocytes in substantia propria(8). Duration of therapy, irrespective of type, for 3 years or more was noted to result in greater subclinical inflammation(8).
Sherwood M et al in their study demonstrated high concentrations of macrophages, lymphocytes (both intraepithelial and subepithelial), mast cells, fibroblasts, as well as a decrease in goblet cell density in patients receiving
anti-glaucoma drugs for 7.7 years, compared to patients with virgin conjunctiva(19). Baudouin C also found significant cell infiltrations in conjunctiva of patients receiving one beta-blocker for several years but were unable to
show a difference between treatments duration of greater than or less than 3 years(22).
The fibroblast number had positive correlation with IOP in both POAG and PACG groups, however not statistically significant. At 4 weeks -For POAG group 31% and 38% patients with pre- operative sub conjunctival fibrosis went on
to form filtering bleb morphology and high reflectivity on ASOCT respectively. For PACG group 14.3 and 33.3 % with preoperative conjunctival fibrosis went on to form a filtering bleb morphology and high reflectivity on ASOCT
respectively. At 4 months (last follow up)-For both PACG & POAG group: All patients with no pre op fibrosis went on to develop blebs with low reflectivity on ASOCT. Almost 40% (POAG) & 30% (PACG) patients with pre op
conjunctival fibrosis developed blebs with high reflectivity. 31% (POAG) and 14% (PACG) of filtering bleb on ASOCT had fibrosis. Inter group difference did not attain statistical significance at any point.
The number of cells CD3, CD68 had negative correlation with preoperative IOP in both groups. These associations were not statistically significant. The number of goblet cells had non-significant positive correlation with
preoperative IOP in both groups.
Mean deviation value in visual fields at preoperative level ranged from 2.56-33.58, with value of -19.78 ± 12.08 decibel in POAG group. At 4 months post-operative value the MD was 20.56 ± 12.28 decibels, a 0.77 ± 0.63 decibel,
statistically significant change (p=0.002). In PACG group, mean MD value was 24.03 ± 7.29 decibels in preoperative period which reduced to 25.25 ± 8.08 decibels by 4 months, change of 1.87 ± 3.22 decibels, difference not being
statistically significant.
Postoperative complications are found be no different in trabeculectomy done for PACG and POAG. Current study was not without limitations. Sample size was small, with 15 patients in each group with short follow up of 4 months.
This curtailment was due to COVID 19 pandemic and patient lost to follow up. Further studies for large group over a longer follow up are needed to substantiate the findings of current study.
Trabeculectomy surgery helps in IOP control with better results in POAG compared to PACG. Complication profile is similar in both cases. Significant association of preoperative inflammation with IOP control could not be proved
with this study. CD3+, CD20+ cells were found to be more in both group with respect to controls and CD68 cells were found to be less compared to controls although intergroup POAG vs PACG difference was NS. Further studies with a
large sample size and longer follow up is needed to substantiate the findings of this study. Further studies comparing bleb morphology in POAG and PACG cases are needed. Further studies correlating bleb morphology and cellular
profile are needed.
Reference:
1. Quigley HA. The number of people with glaucoma worldwide in 2010 and 2020. Br J Ophthalmol. 2006 Mar 1;90(3):262–7.
2. Foster PJ. Glaucoma in China: how big is the problem? Br J Ophthalmol. 2001 Nov 1;85(11):1277–82.
3. Tielsch JM, Sommer A, Katz J, Javitt J. Racial Variations in the Prevalence of Primary Open-angle Glaucoma. :6.
4. Klein BEK, Klein R, Sponsel WE, Franke T, Cantor LB, Martone J, et al. Prevalence of Glaucoma. Ophthalmology. 1992 Oct;99(10):1499–504.
5. Dandona L, Dandona R, Mandal P, Srinivas M, John RK, McCarty CA, et al. Angle-closure Glaucoma in an Urban Population in Southern India. 2000;107(9):7.
6. Jacob A, Thomas R, Koshi S, Braganza A, Muliyil J. Prevalence of primary glaucoma in an urban South Indian population. :6.
7. Quigley HA. Glaucoma in China (and worldwide): changes in established thinking will decrease preventable blindness. Br J Ophthalmol. 2001 Nov 1;85(11):1271–2.
8. Broadway DC, Chang LP. Trabeculectomy, Risk Factors for Failure and the Preoperative State of the Conjunctiva: J Glaucoma. 2001 Jun;10(3):237–49.
9. Maheshwari D, Kanduri S, Kadar M, Ramakrishnan R, Pillai M. Midterm outcome of mitomycin C augmented trabeculectomy in open angle glaucoma versus angle closure glaucoma. Indian J Ophthalmol. 2019;67(7):1080.
10. Sihota R, Gupta V, Agarwal HC. Long-term evaluation of trabeculectomy in primary open angle glaucoma and chronic primary angle closure glaucoma in an Asian population. Clin Experiment Ophthalmol. 2004 Feb;32(1):23–8.
11. Cvenkel B, Ihan A. Ocular Surface Changes Induced by Topical Antiglaucoma Monotherapy. Ophthalmologica. 2002;216(3):175–9.
12. Mastropasqua R, Fasanella V, Agnifili L, Curcio C, Ciancaglini M, Mastropasqua L. Anterior Segment Optical Coherence Tomography Imaging of Conjunctival Filtering Blebs after Glaucoma Surgery. BioMed Res Int. 2014;2014:1–11.
13. Kawana K, Kiuchi T, Yasuno Y, Oshika T. Evaluation of Trabeculectomy Blebs Using 3-Dimensional Cornea and Anterior Segment Optical Coherence Tomography. Ophthalmology. 2009 May;116(5):848–55.
14. Pfenninger L, Schneider F, Funk J. Internal Reflectivity of Filtering Blebs versus Intraocular Pressure in Patients with Recent Trabeculectomy. Investig Opthalmology Vis Sci. 2011 Apr 14;52(5):2450.
15. Singh M, Chew PTK, Friedman DS, Nolan WP, See JL, Smith SD, et al. Imaging of Trabeculectomy Blebs Using Anterior Segment Optical Coherence Tomography. Ophthalmology. 2007 Jan;114(1):47–53.
16. Tominaga A, Miki A, Yamazaki Y, Matsushita K, Otori Y. The Assessment of the Filtering Bleb Function With Anterior Segment Optical Coherence Tomography. J Glaucoma. 2010 Oct;19(8):551–5.
17. Kokubun T, Tsuda S, Kunikata H, Himori N, Yokoyama Y, Kunimatsu-Sanuki S, et al. Anterior-Segment Optical Coherence Tomography for Predicting Postoperative Outcomes After Trabeculectomy. Curr Eye Res. 2018 Jun
3;43(6):762–70.
18. Tsutsumi-Kuroda U, Kojima S, Fukushima A, Nakashima K-I, Iwao K, Tanihara H, et al. Early bleb parameters as long-term prognostic factors for surgical success: a retrospective observational study using three-dimensional
anterior-segment optical coherence tomography. BMC Ophthalmol. 2019 Dec;19(1):155.
19. Sherwood MB, Grierson I, Milgar L, Hitchings RA. Long-term Morphologic Effects of Antiglaucoma Drugs on the Conjunctiva and Tenon’s Capsule in Glaucomatous Patients. Ophthalmology. 1989 Mar;96(3):327–35.
20. Skuta GL, Parrish RK. Wound healing in glaucoma filtering surgery. Surv Ophthalmol. 1987 Nov;32(3):149–70.
21. Joseph JP, Miller MH, Hitchings RA. Wound healing as a barrier to successful filtration surgery. Eye. 1988 Jan;2(S1):S113–23.
22. Baudouin C, Pisella P-J, Fillacier K, Goldschild M, Becquet F. Ocular Surface Inflammatory Changes Induced by Topical Antiglaucoma Drugs. 1999;106(3):8.
23. Nuzzi R, Finazzo C, Vercelli A, Cracco C. Conjunctiva and subconjunctival tissue in primary open-angle glaucoma after long-term topical treatment: an immunohistochemical and ultrastructural study. Graefes Arch Clin Exp
Ophthalmol. 1995 Mar;233(3):154–62.
Leave a Comment